
Most portfolio trend reports fail for the same reason: the comparable base is wrong before a single ratio is calculated. A property acquired mid-year gets blended into a same-store average, a building in lease-up drags down occupancy for the whole pool, and a sold asset distorts the year-over-year expense line. The arithmetic is fine. The comparison is not.
Multifamily comparative financials are the discipline of placing two or more periods, properties, or peer sets side by side on a consistent basis so the differences that remain are real operating signals rather than data artifacts. Getting that right requires three things: a defensible comparable set, a standardized chart of accounts, and a reporting layer that keeps the variance story attached to the numbers.
What Comparative Financials Actually Compare
Comparative analysis in a multifamily portfolio is not a single report. It is a family of comparisons, each answering a different question. The same income statement can support any of them, but only if the analyst states which lens is being applied and why.
| Comparison lens | Question it answers | Common pitfall |
|---|---|---|
| Period over period | Is this property improving or deteriorating versus its own history? | Mixing acquisitions or dispositions into a same-store base |
| Budget versus actual | Where did the plan miss, and was the miss in revenue or expense? | Budgets built on assumptions that no longer reflect the market |
| Property versus peer set | Is underperformance asset-specific or market-wide? | Peers that differ in vintage, unit mix, or submarket |
| Portfolio roll-up | What is happening at the fund or portfolio level? | Averaging away a wide spread between strong and weak assets |
Each lens produces a different conclusion from identical source data. A 3 percent revenue decline might be a property problem under a peer comparison and a market problem under a period comparison. The analyst's job is to run both and reconcile them.
Build the Comparable Base Before You Compare Anything
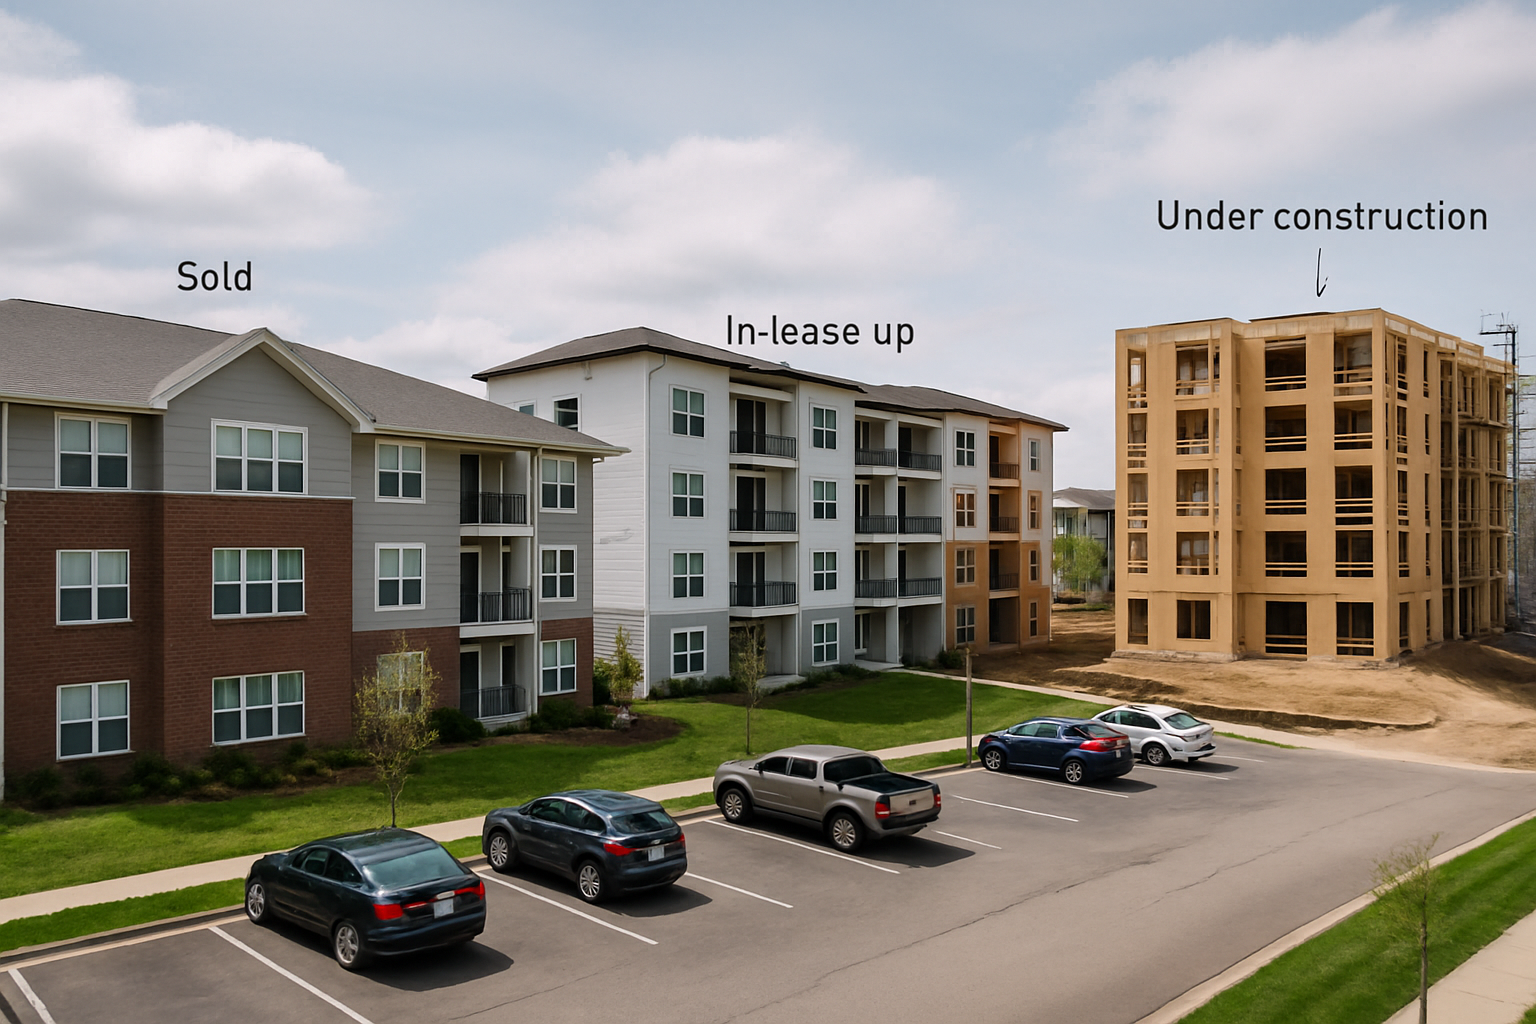
Standard comparable-period analysis excludes properties that, during the periods being compared, were acquired, sold, under development, or undergoing lease-up. That exclusion rule is not bureaucratic caution. It removes assets whose financial profile is structurally different from a stabilized operating property, and it prevents transaction timing from masquerading as operating performance.
A practical comparable base follows a few working rules:
- Define the stabilization threshold in writing before you pull data, and apply it uniformly.
- Keep acquired, disposed, development, and lease-up assets in a separate schedule so portfolio totals still reconcile.
- Disclose the excluded units and their share of portfolio net operating income alongside the same-store result.
- Re-test the base each reporting cycle, because assets cross the stabilization line over time.
When the excluded bucket is large, the same-store trend is a partial view. Reporting it without the reconciliation invites a false sense of precision at the investment committee table.
Map Every Line Item to a Common Chart of Accounts
Portfolios rarely run on one property management system. Rent rolls and financial statements arrive from Yardi, RealPage, and Entrata with different account names, different grouping logic, and different treatments of items like concessions, utility recoveries, and non-recurring repair costs. Two properties can report identical economics under two different labels.
Standardization is the step that makes comparison possible. Every account code maps to a canonical line, every canonical line rolls into a subtotal, and every subtotal ties back to the source statement so the mapping can be audited. Without that layer, a trend line reflects naming conventions as much as operations. With it, the analyst can move from raw statement to variance narrative without re-keying anything.
Revenue Trends: Occupancy, Rent, and Other Income
Revenue deserves to be decomposed rather than compared as a single figure. A flat top line can hide rising gross rent offset by rising concessions, or stable occupancy offset by a shifting unit mix. Reading the trend means tracking gross potential rent, loss to lease, concessions, vacancy, and other income separately, then rebuilding effective gross income from those components.
Comparing rental values and rental trends in the micro-market gives the portfolio number a reference point. A property holding occupancy while market rents soften tells a different story than one holding occupancy in a rising market, even if the reported revenue line looks similar in both cases.
Expense Ratios and the 35 to 55 Percent Band
Multifamily expense ratios typically fall between 35 percent and 55 percent of effective gross income. That band is wide, and the drivers behind a specific property's position inside it matter more than the position itself. Asset age, unit count, climate, utility structure, staffing model, and the local tax and insurance environment all push the ratio in different directions.
Underwriting discussions often test whether a 50 percent placeholder holds up against property-level reality. As a screening assumption it has the virtue of simplicity. As an operating benchmark it can be misleading, because a property at the low end of the range and a property at the high end both look normal in isolation while behaving nothing alike. For comparative work, the better practice is to place each property in the band, then explain the gap to the portfolio median line by line.
Expense trend analysis should separate controllable from non-controllable categories. Payroll, repairs and maintenance, turnover costs, and administrative spend respond to management decisions. Property taxes and insurance often do not, at least not on a twelve-month horizon, and mixing them into one "expenses up" conclusion obscures where action is possible.
Turnover Economics and Resident Retention
Retention shows up in comparative financials as a cost story. Keeping an existing resident is often $4,000 to $6,000 per unit cheaper than turning that unit, once turn costs, marketing, vacancy loss, and leasing labor are counted. That gap makes retention a first-order number in trend analysis rather than an operational footnote.
Operational value-add strategies lean on exactly this lever, focusing on improved management and operational efficiency rather than major renovation, including optimizing utility usage, implementing cost-saving measures, and improving resident retention. In comparative terms, a portfolio improving retention should show it in lower turn costs, lower marketing spend, and steadier occupancy, and those movements should be visible across three periods before the trend is treated as durable.
Risk Signals and Failure Indicators
Research on financial failure among insured multifamily housing projects surveys the empirical literature to explain why these assets fail. The value for an analyst is directional: failure tends to be a pattern that develops over multiple periods rather than a single bad quarter. Comparative reporting is what makes the pattern visible, because a portfolio-level average can hold steady while a subset of assets deteriorates underneath it.
Underwriting and asset management both require careful analysis of historical performance, market trends, and property-specific factors before capital is committed. Portfolio trend reporting is where those three inputs meet, and where a divergence between a property's own history and its market's trajectory should trigger a closer look.
Financing Context in Comparative Analysis
Capital structure shapes what the operating comparison means. A diversified income stream from multiple units reduces risk and can lead to more favorable loan terms than single-family exposure, which means the same net operating income trend has different consequences across portfolios depending on leverage and lender terms.
Cross-border portfolios add another layer. Research comparing multifamily mortgage lending in Canada and the United States shows the two markets differ in structure and practice, so performance comparisons spanning both countries need local financing context attached to the trend, not a single blended benchmark.
Benchmarking Against the Micro-Market
Internal comparisons tell you how a property performs against its own history and its sister assets. External comparison tells you whether that performance is good. Micro-market data covering rental values, comparative market analysis, and rental trends gives the portfolio number an outside reference, which is what separates an internal reporting exercise from an investment decision input.
The pairing matters. A property beating its own prior year while trailing its submarket is losing ground. A property trailing its own prior year while leading its submarket may be absorbing a market-wide correction. Neither conclusion is reachable from a single dataset.
Reporting the Trends to Decision Makers
Comparative output is only useful if the audience can act on it. A portfolio trend package should lead with the same-store result, reconcile the excluded assets, rank properties by variance contribution, and attach a short narrative to each material movement. Percentages without causes get filed. Percentages with causes get funded, repositioned, or sold.
Repeatability is what makes this sustainable across cycles. When the comparable base, the account mapping, and the variance logic live in a documented process, the analysis takes hours instead of weeks and the definition of each metric does not drift between reporting periods. Coastwise Analytics handles that layer for institutional teams by parsing rent rolls and financial statements from Yardi, RealPage, and Entrata into standardized comparative reports, portfolio benchmarks, and performance memos ready for review.
Frequently Asked Questions
What are comparative financials in multifamily?
They are financial statements presented side by side across two or more periods, properties, or peer groups so differences can be compared directly. In multifamily, that usually means a standardized income statement with occupancy, revenue components, and expense categories aligned across the portfolio, plus the supporting schedules that explain what changed and why.
How many periods should a portfolio trend analysis cover?
Three periods is a reasonable minimum for calling something a trend rather than a fluctuation, with a trailing twelve month view for seasonality. Longer histories help separate durable shifts from one-time events, but only if the comparable base has been held consistent across those periods or the changes disclosed.
Which properties should be excluded from a same-store comparison?
Standard practice excludes properties that were acquired, sold, under development, or in lease-up during the periods being compared. Those assets have structurally different financial profiles, so including them mixes transaction and construction timing into what is supposed to be an operating performance measure. Report them separately and reconcile the totals.
Is a 50 percent expense ratio a safe underwriting assumption?
Multifamily expense ratios typically range from 35 to 55 percent of effective gross income, so a single placeholder sits inside the band but tells you little about a specific asset. Age, utility structure, staffing, and local tax and insurance conditions drive the position within the range. Verify assumptions against the property's own history and market.
Why does resident retention appear in financial trend reports?
Retention is cheaper than turnover by a wide margin, often $4,000 to $6,000 per unit when turn costs, marketing, vacancy loss, and leasing labor are combined. Because that gap is large relative to most operating line items, changes in retention show up quickly in expense trends and should be tracked as an operating metric.